Are food deserts also food monocultures?
Drive through a wealthy country, such as the United States, and one thing you will notice is a high degree of repetition in the scenery. Highways cross through large fields of near-identical corn and soy crops, punctuated by towns containing a similarly small set of franchises. This is not an easy knock on the cultural blandness of contented societies but rather, I suspect, two factors deeply connected with our path to near-limitless calories.
For the first time in history our species has achieved the feat of having more overweight people than those who go hungry. How we got here is an interesting story combining the rise of the technology needed to run large-scale farms with agricultural policies geared towards the production of cheap staple crops (For a good introduction to the topic my favorite is the documentary King Corn.). What sounds strange, at least at first, is that the issue of malnourishment has not declined in a similar fashion. This is an immediate result of improvements made in the availability of cheap, though not necessarily nutritious, calories. The areas where this discrepancy lives has a name: food deserts. An area qualifies as a food desert, according to the US Department of Agriculture (USDA) if it meets the following two criteria:
1. They qualify as “low-income communities”, based on having: a) a poverty rate of 20 percent or greater, OR b) a median family income at or below 80 percent of the area median family income; AND
2. They qualify as “low-access communities”, based on the determination that at least 500 persons and/or at least 33% of the census tract’s population live more than one mile from a supermarket or large grocery store (10 miles, in the case of non-metropolitan census tracts).
If you’re interested in seeing if you live in a food desert check the USDA’s map here.
Think of the word ‘desert’. In a standard ecological sense it is a place which lacks access to significant water. With food deserts the name is somewhat of a misnomer as there is still plenty of food available from fast food restaurants and convenience stores, what these places could better be described as would be ‘nutrient deserts’.
Now with a lack of nutrients is there a corresponding lack of choice? Do the same monocultures which show up in our production of cheap food also show up in the venues available for its consumption?
How to go about testing this question? First, define a metric which could quantify the diversity of food sources in a community. Second, compare this diversity metric to the median income of the community and to its access nutritious food. Without positing any cause and effect at this point it would be possible to test if communities which could be called food (nutrient) deserts would also tend to have a low diversity in the sources for nutritious food.
The second metric can be taken from already existing data sets, such as those generated by the USDA. For the first metric we have a concept which we can borrow from ecology: the Shannon index.
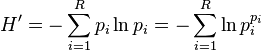
Unpacking this equation the variables are as follows:
H is the Shannon index, also known as the Claude-Shannon entropy of a system. Entropy, in general, is a measure of how much information it takes to describe a system. It is also a good way to describe the complexity of a system. For example, if one has an image file which is 480 pixels on a side and completely filled with the same shade of red it would be easy to compress the file with a brief description of the image dimensions and the fill color, thus giving the image a low measure of entropy. A similarly sized section of the Mona Lisa has a far higher measure of entropy as it would take far more information to describe the image in a more compressed state. The more complex a system the larger the Shannon index. In applying this formula to describing the diversity of ecosystems one will find that diverse ecosystems, such as a coral reef, will tend to have high entropies and that ecosystems dominated by large numbers of a few species, such as polar oceans, tend to have low entropies.
i is an index running from 1 to R. In an ecosystem the number R describes how many species there are.
p_i is the population of species i. This is determined by counting, or more often estimating, the population of the species in an ecosystem.
To give a few examples of how to use this formula consider a simple ecosystem with 100 brine shrimp, 900 bacteria, and 9,000 pieces of algae. The total number of organisms is 100+900+9,000 = 10,000. The fraction of the overall population covered by brine shrimp is therefor 100/10,000=0.01, the bacteria cover a fraction of 900/10,000=0.09, and the algae cover the remaining 0.90. Running the sum then looks like the following:
H = -0.01*ln(0.01) + -0.09*ln(0.09) + -0.90*ln(0.90) = 0.358
How would this then compare to a hypothetical ecosystem where we had 100 species, each of which took up an equal share (0.01) of the population? In that case our entropy for the ecosystem would be:
H = -0.01*ln(0.01) + -0.01*ln(0.01) + …. + -0.01*ln(0.01) = 4.61
These are far simpler cases than would typically be encountered in nature, but they demonstrate how we can succinctly differentiate diverse and homogenous ecosystems.
Now how would this play out in our urban food distribution ecosystem? In this scenario the number of unique venues selling food in a given area, whether it is a convenience store or high-end restaurant, is our value R. In a neighborhood with 100 boutiques and 3 franchises R would be 103. The population then of each venue could be done by simply counting up each venue type. Once the tally is collected a few quick calculations would determine the population fraction each venue covers as well as the overall diversity of the urban food venue ecosystem. The data collection itself could be done on foot with a notebook, or a laptop with detailed enough access to local business data.
In places dominated by a few franchises one would then expect to see a low level of food distribution diversity, but would this then be tied to its quality and availability? Would this diversity in turn have anything to do with the income of the area? It could be reasonably argued that diverse ecosystems are more resilient to external shocks as niches vacated by one extinction could be filed by similar species. However, polar ecosystems often have large biomasses even without a myriad of species.
In either case this appears to be a hypothesis which could be tackled by a team of citizen scientists in the nascent field urban ecology.
Interested in starting such a study? Feedback is appreciated at levisimons@gmail.com .
(Originally published here on December 8th 2014)

Comments
Post a Comment